Monitoring
Track and monitor the execution of your integration processes.
- Monitor the status of integrations;
- Check the start/end date/time of the processes;
- Analyze the processing logs.
The Monitoring panel is divided into three parts: General Listing, Integration Listing and Monitoring Log.
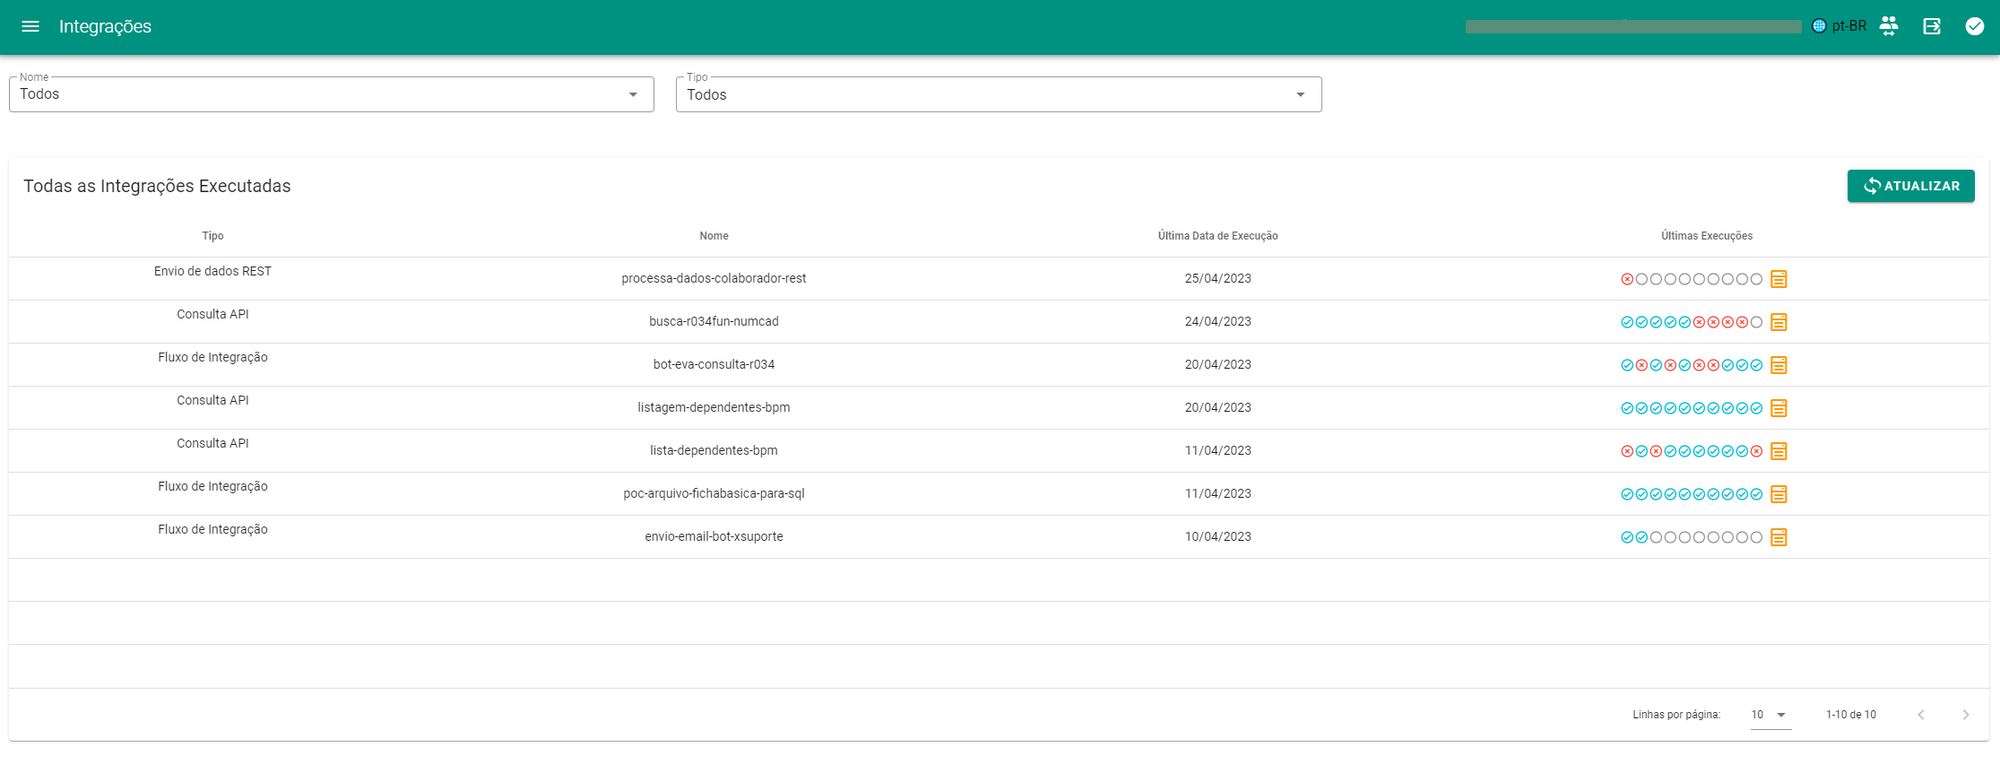
The General Listing provides a view of the latest integrations processed in the environment, displaying, in decreasing order of time, the order in which the integrations were processed, along with the status of the last 10 executions. You can go directly to the Monitoring Log of any of the last executions or to the Log Listing of the Integration in question.
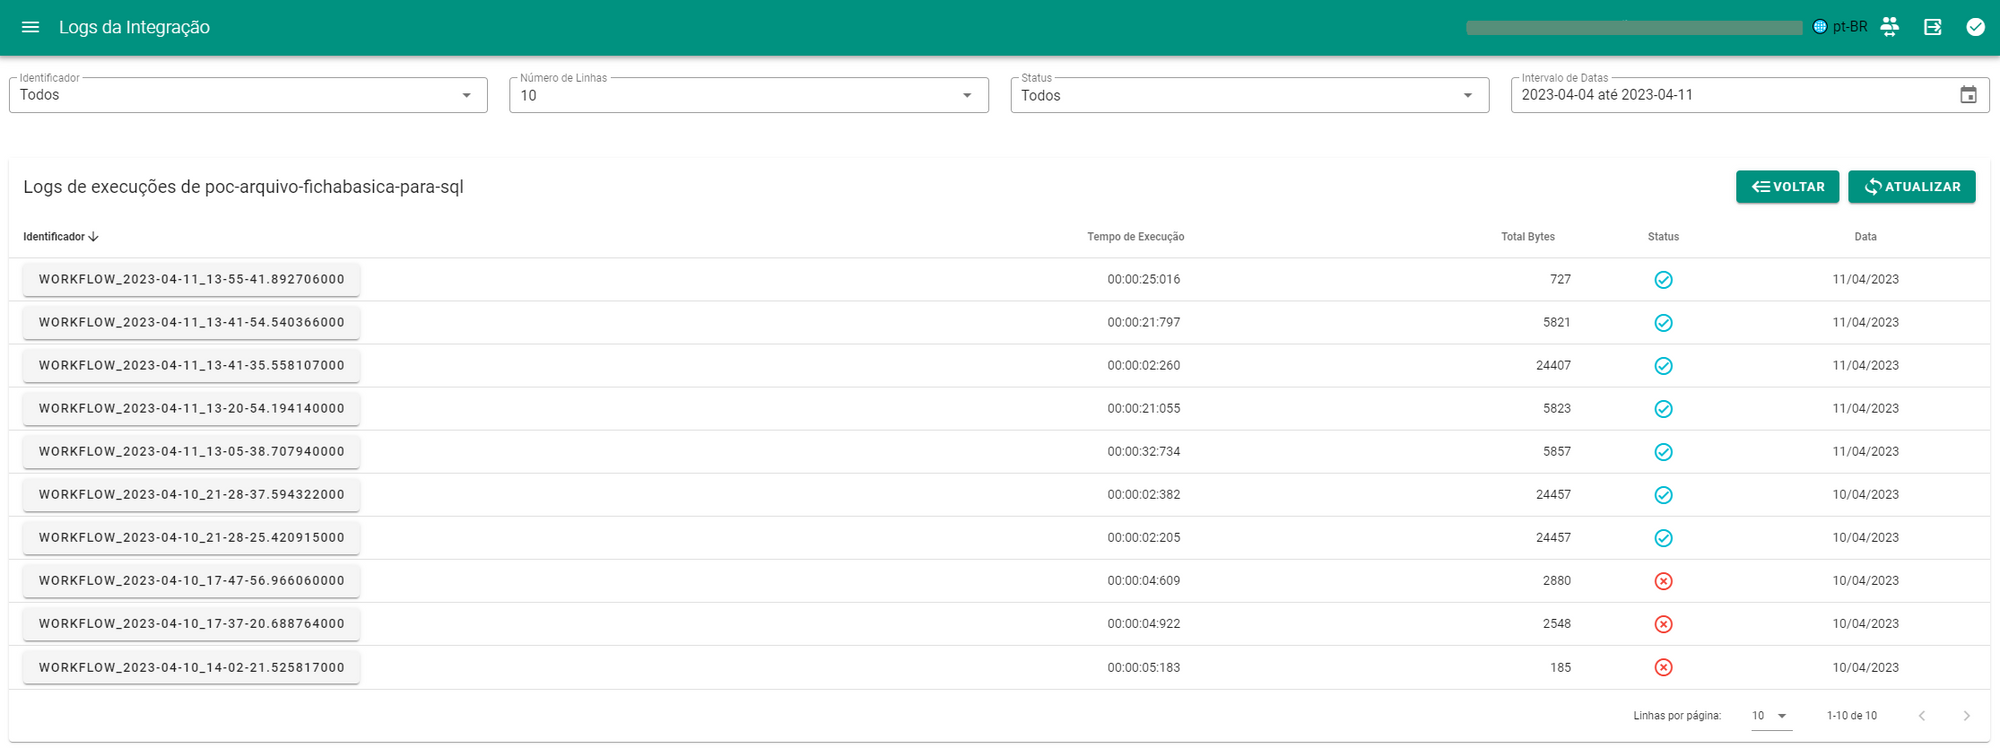
On the second screen we have the List of Monitoring Records for a specific integration. The Monitoring Log Identifier is composed of the integration type and the execution date in the formatYEAR-MONTH-DAY_HOUR-MINUTE-SECOND-MILLISECONDS , this screen also displays the Execution Time of each integration call, TotalBytes represents the amount of information displayed in the log, Status indicates whether the flow processed all the Actions and the day on which the integration was performed. You can filter and organize the data according to the Identifier (auto-completion), Number of Rows to be returned in the panel, integration status (success, failure) and you can also define the relevant date range for analysis. To access the details of a specific processing, simply click on the Identifier in question.
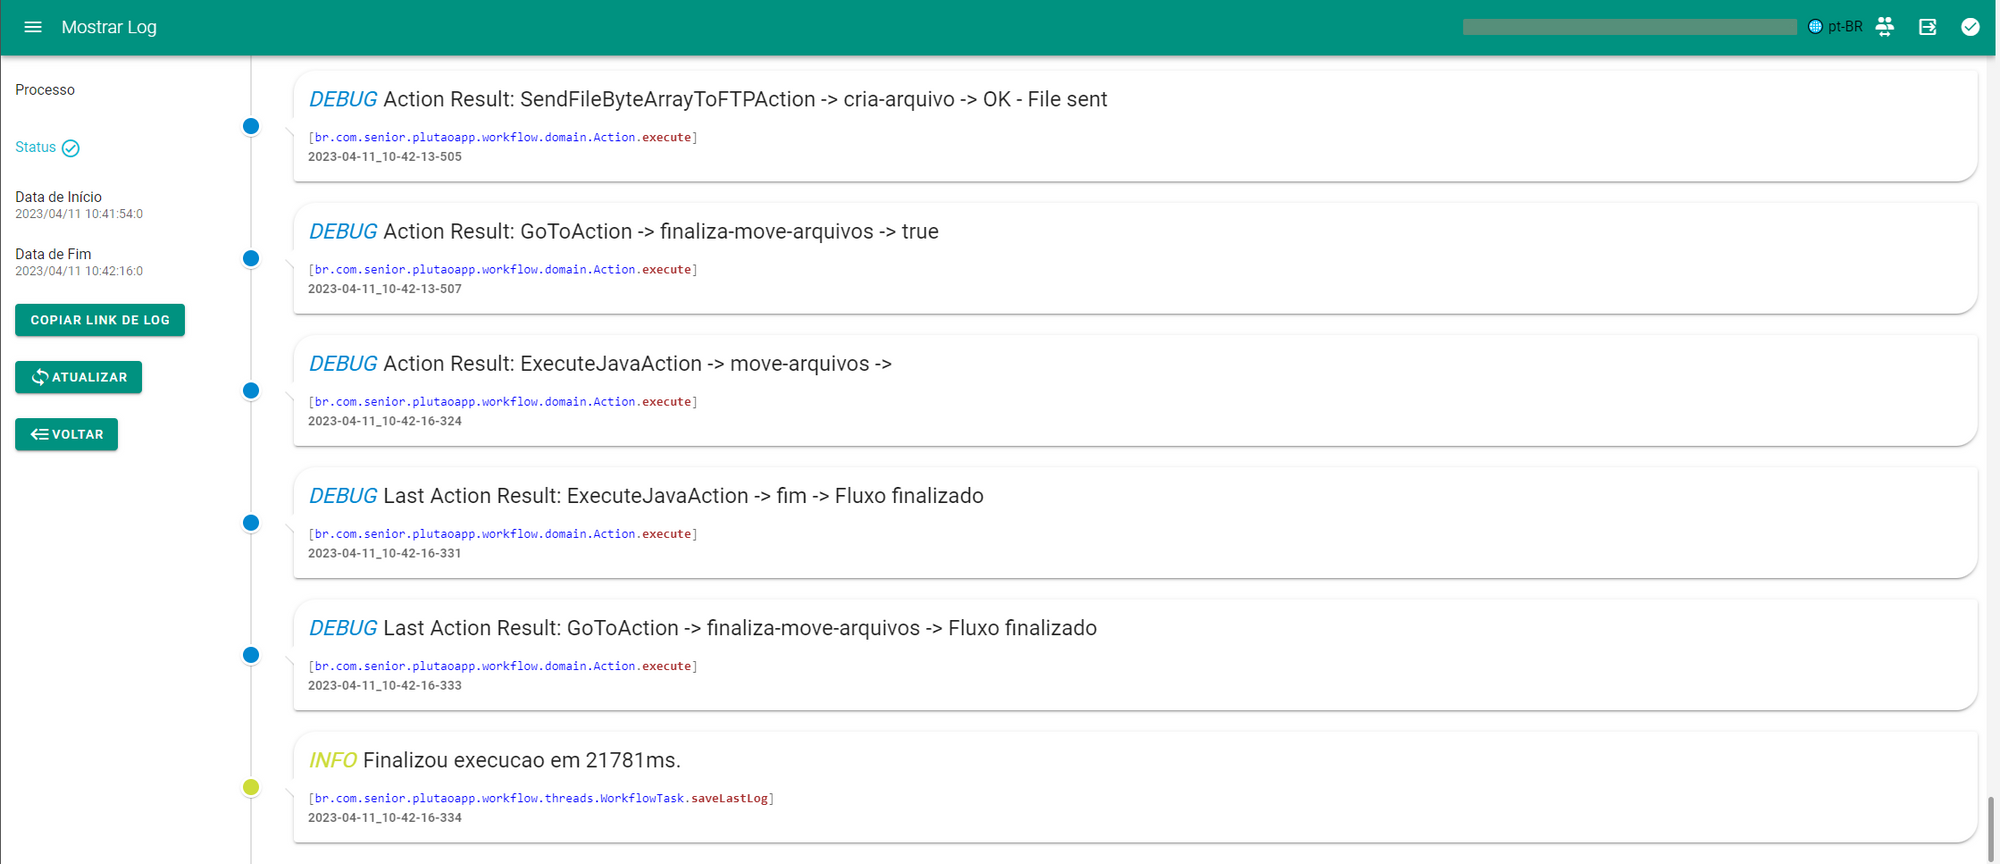
The Monitoring Log will display the processing start and end date, result status, and all log lines for the integration. By default, the platform only writes detailed lines informing the start, end and any processing errors, but it is also possible to activate monitoringdebug, responsible for displaying the status of each processing in more detail or even defining its own lines of information through dedicated Actions (in the case of Integration Flows).