Supervisory panel
Environment hierarchy
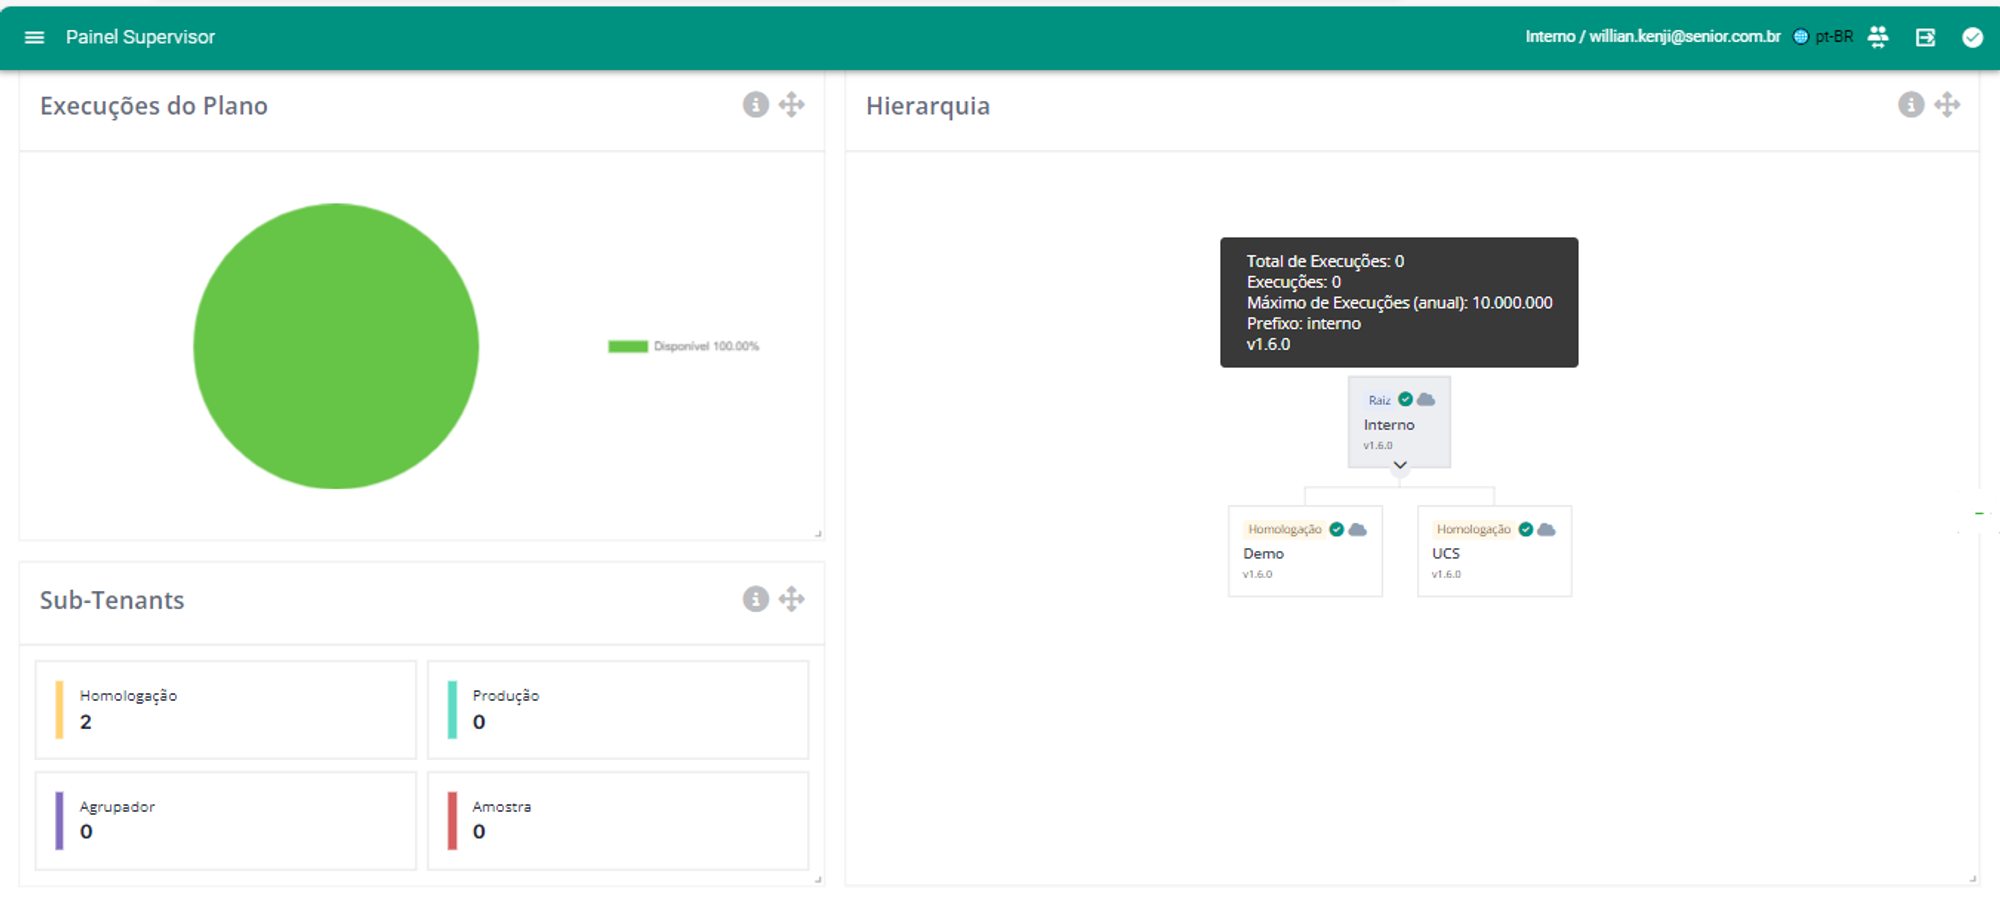
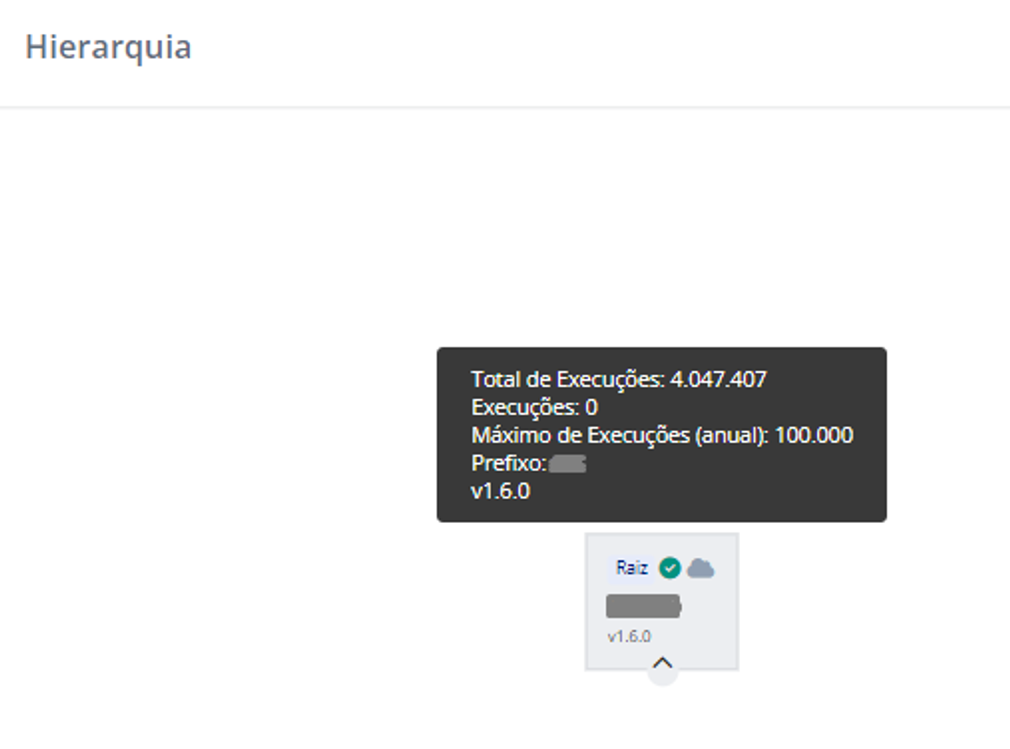
Under a CONNECT license, it is possible to create multiple integration environments, known asSub-Tenants. The license is represented by aTenant Root, where all platform users are managed (including permissions and access), and also where integration Sub-Tenants and/or Sub-Tenant groups that make up the environment hierarchy are created. This gives us an insight into theEnvironment Hierarchy.
Sub-Tenants can be classified as:
- Grouper: Intended to create collections of Production or Homologation Sub-Tenants;
- Production / Homologation: Environments in which integrations via CONNECT will be developed.
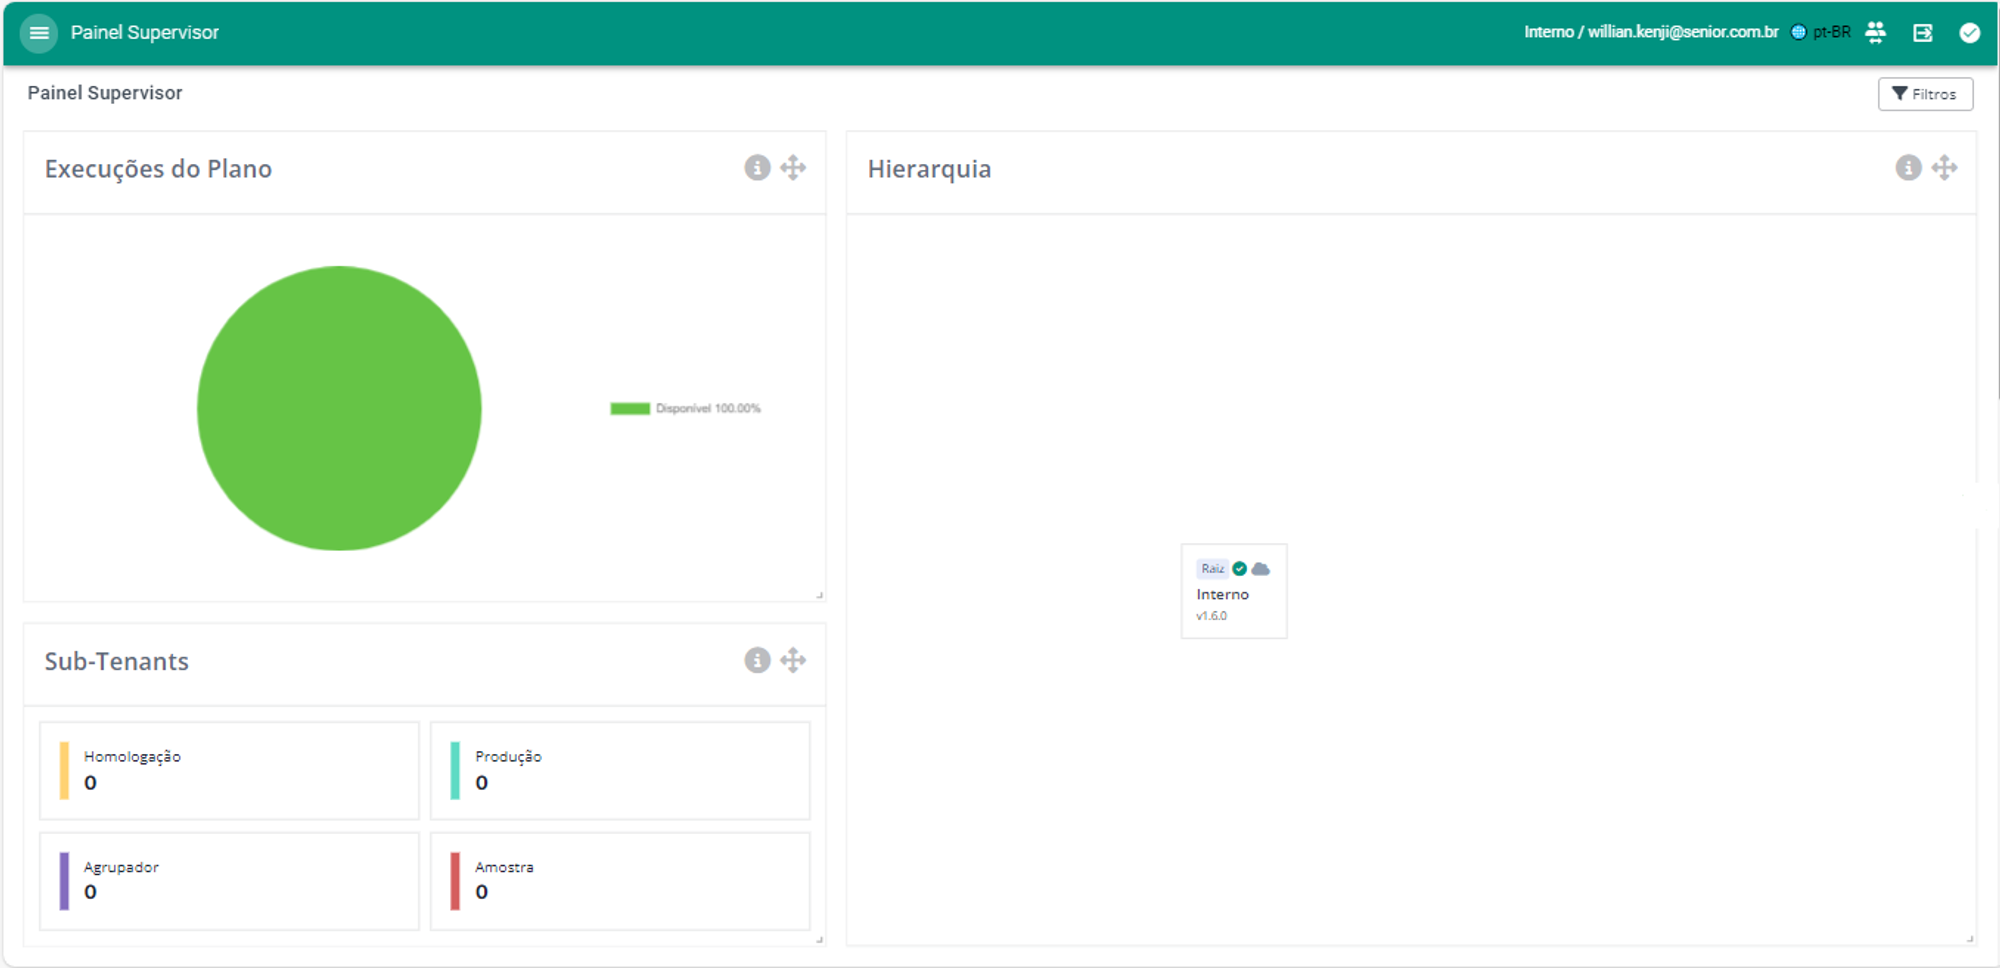
In the graphical representation of the Environment Hierarchy, the Sub-Tenants will be displayed according to the scope accessed (xplatform or homolog). For example, in a license that only has environments of the HOMOLOGATION type, we would have the following view on homologation.seniorconnect.com.br:
homologation.seniorconnect.com.br - Homologation
xplatform.seniorconnect.com.br Overview - Production
Supervisory Panel
A dedicated screen was developed to track the metrics of all integration environments of a given CONNECT License, along with a graphical representation of the Environment Hierarchy. This panel is exclusively accessible to the Supervisor user, generally the person responsible for the CONNECT License.
Monitoring Dashboard Metrics
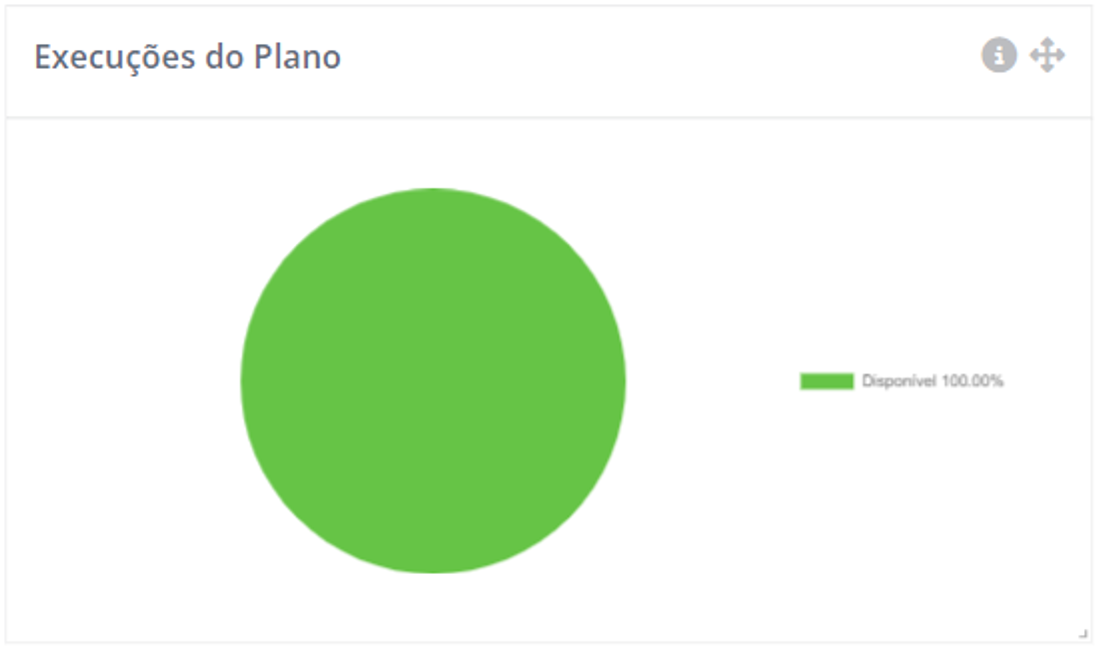
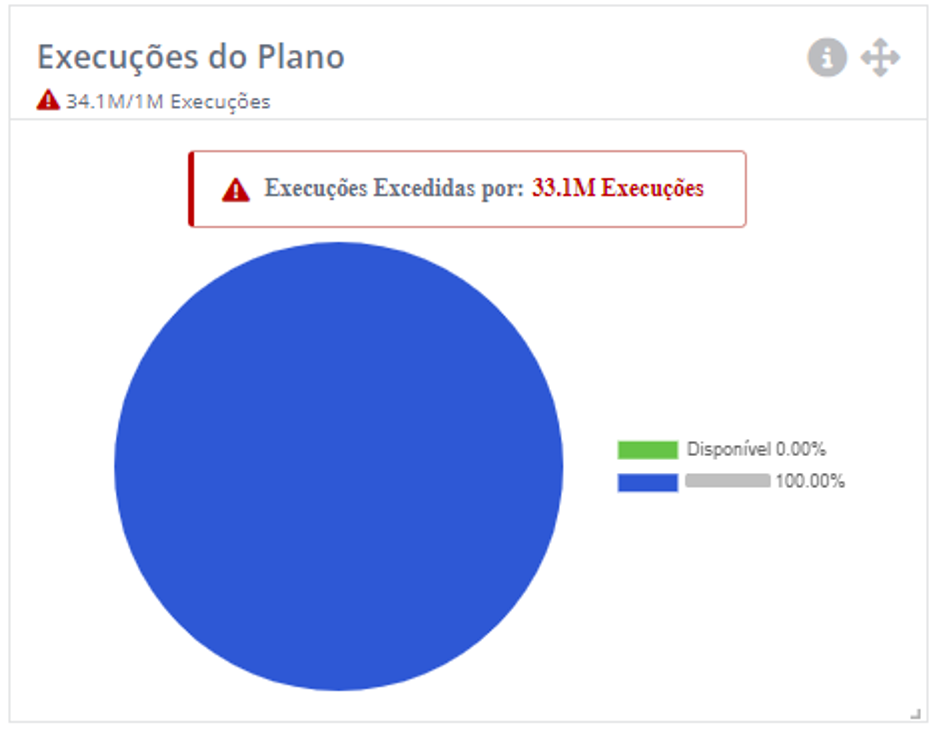
Plan Usage
The total usage of the consumption band can be observed in any of the interfaces in the graphPlan Executions. The information is displayed as a percentage. In cases where the range is exceeded, an indicator is displayed.
The total number of executions of the environment can be seen in the details of theTenant-Root, in the Environment Hierarchy.
Number of executions
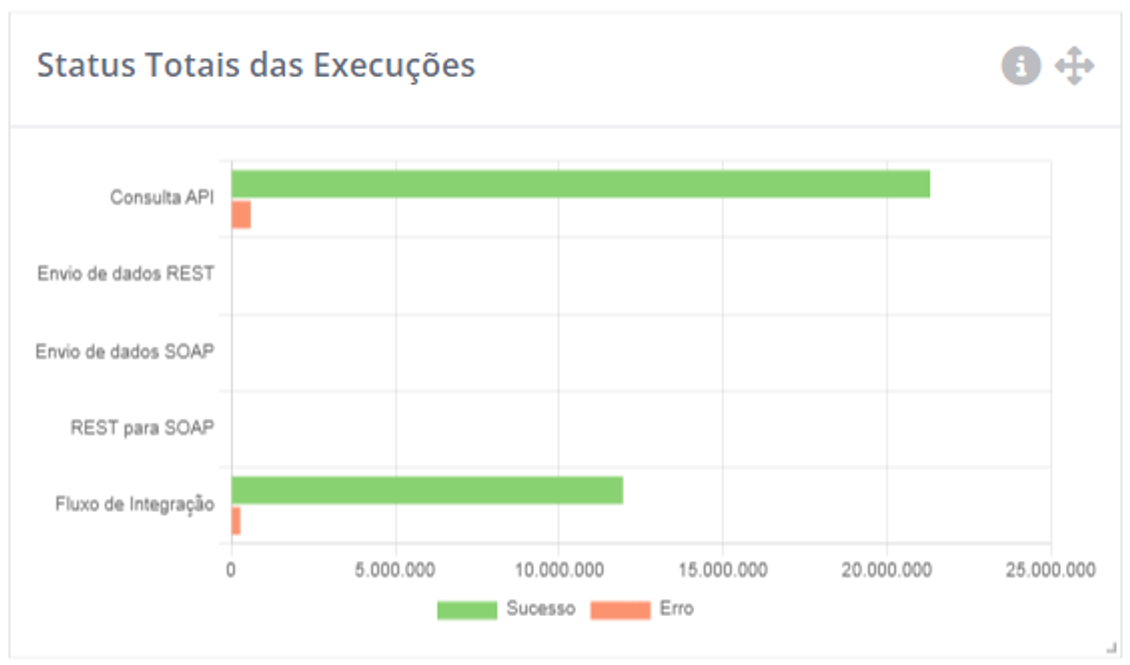
THETotal Execution Status displays the distribution of successes and failures, by integration type, for all sub-tenants related to the accessed interface (homologation or production).
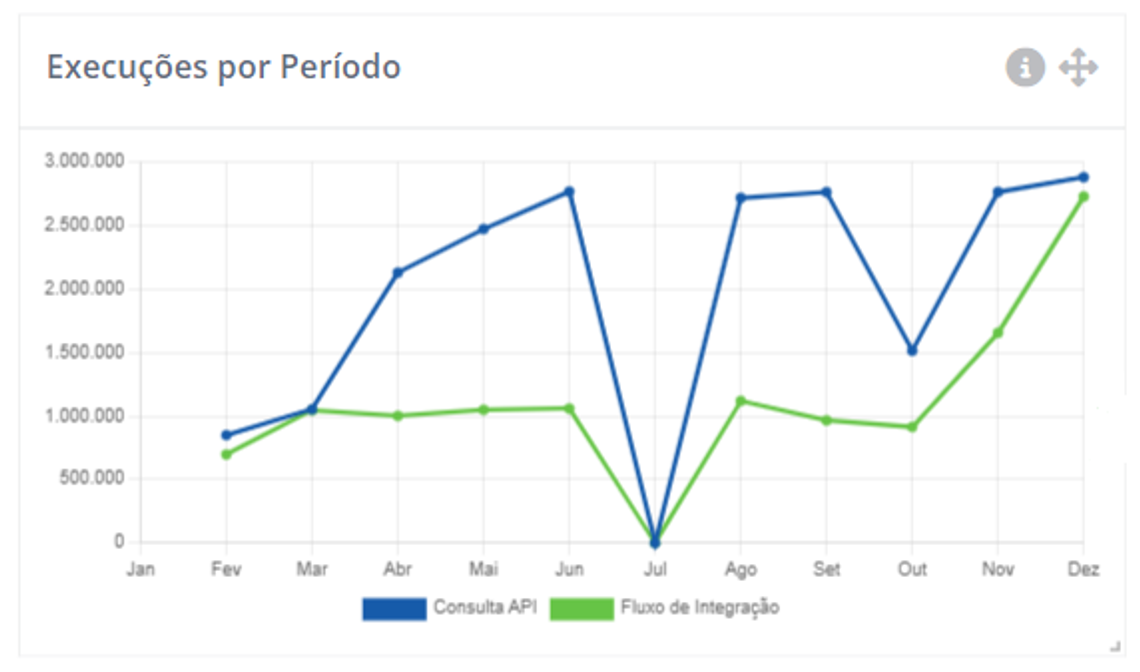
To theExecutions by Period display a total, by month and integration type, of all sub-tenant executions related to the accessed interface (xplatform or homolog).
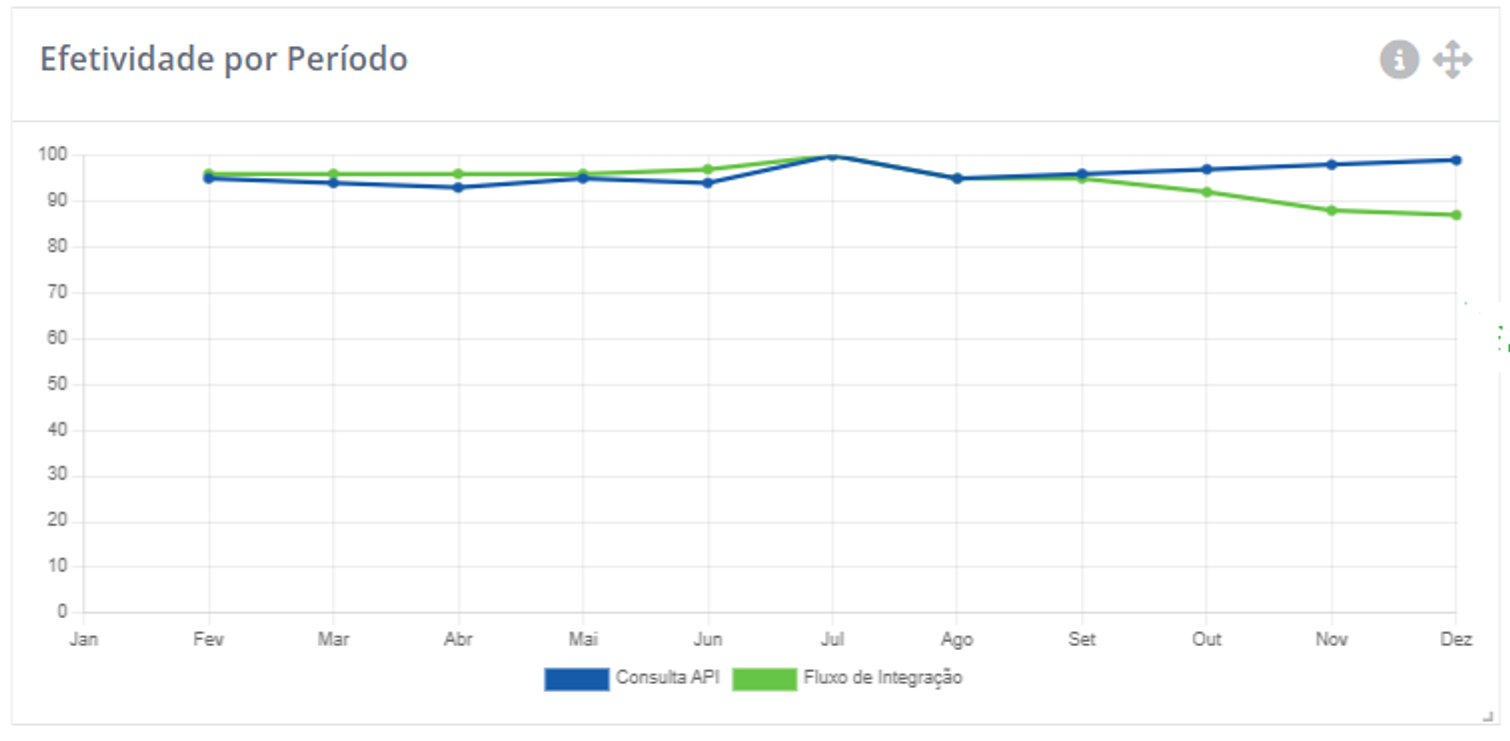
Execution efficiency
THEAverage Effectiveness displays the average effectiveness of all sub-tenants related to the accessed interface (xplatform or homolog).
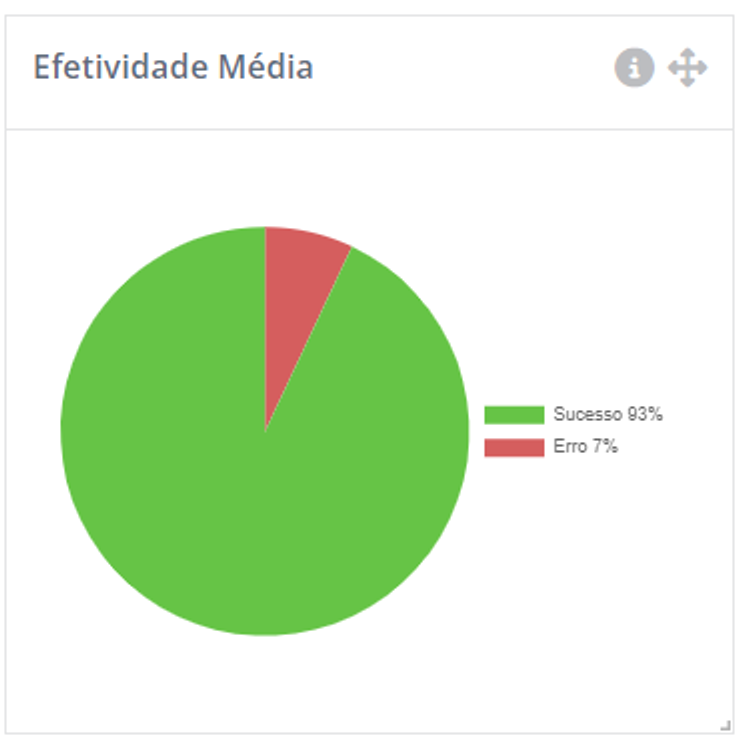
Changes in effectiveness metrics can be tracked in the chartEffectiveness by Period, which displays the effectiveness in each month of the year, classified by type of integration.
Time of Executions
The graph ofAverage Execution Time shows the distribution of average execution time, by integration type, for all sub-tenants related to the accessed interface (homologation or production).
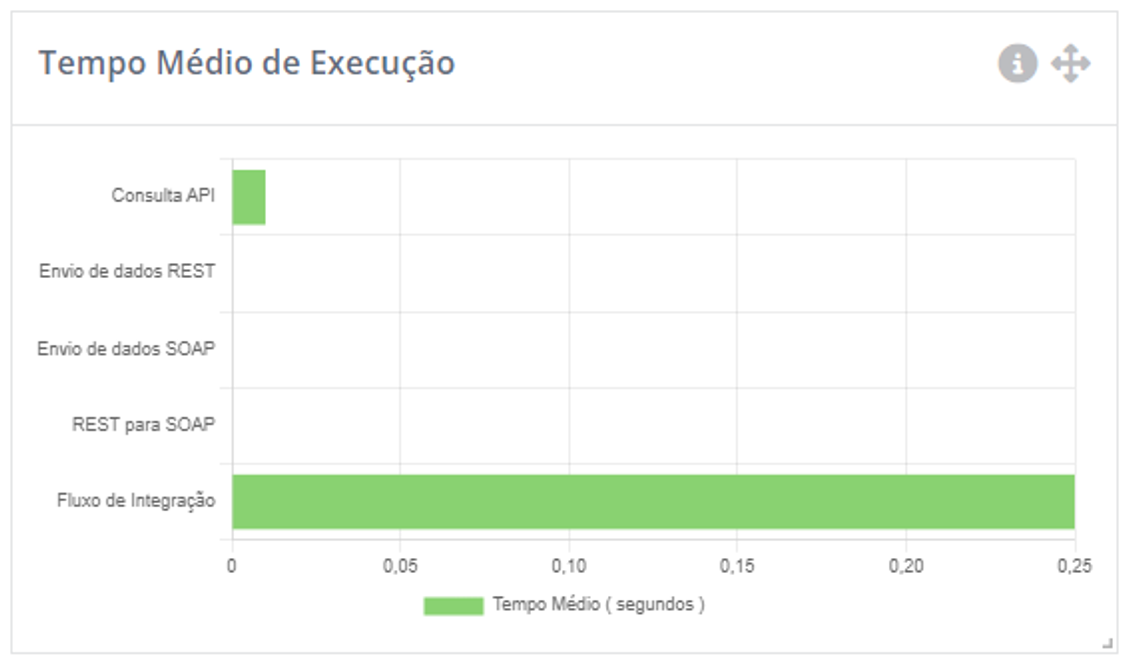
The Average Execution Time by Period displays, by month and integration type, the average execution time in the sub-tenants related to the accessed interface (homologation or production).
Metrics Integration with Prometheus
CONNECT has an API to access metrics in the standardized format of the open-source solutionPrometheus, enabling integration with monitoring dashboards, such asGrafana.
Important
Prometheus metrics may be available depending on the license level. For more information, speak to our account executives.