Analytics Studio — Tutorial
Step 1 of 3 — Create and configure a dataset
On the senior X Platform, access the menuTechnology > Administration > Dataset > New dataset to access the new configuration screendataset.
When starting registration, make the following settings:
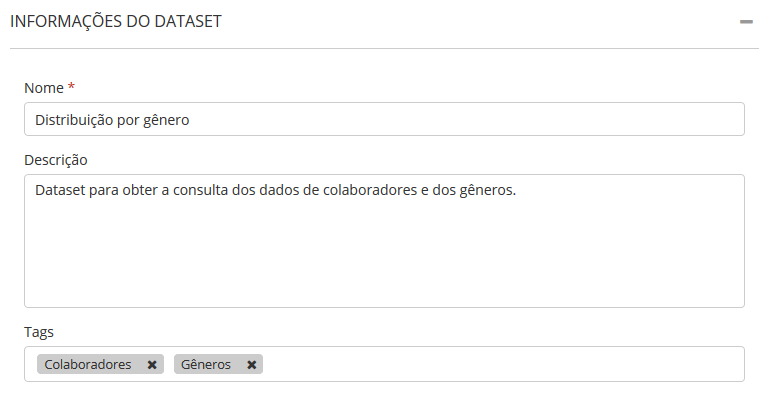
1. Dataset information:
- Name — fill in a name that easily identifies the dataset.
- Description It isTags — optionally provide additional details and tags for the dataset. This will help you search for the dataset when filtering by the tag name in the search field.
2. Dataset configuration:
- Visual editor: Facilitates the creation of the dataset, allowing you to configure the data query using a visual interface.
- SQL Editor: Allows you to query and extract data from the database using SQL commands.
- API: Allows you to obtain API returns for constructing the dataset
For the example of this tutorial, theVisual editor:
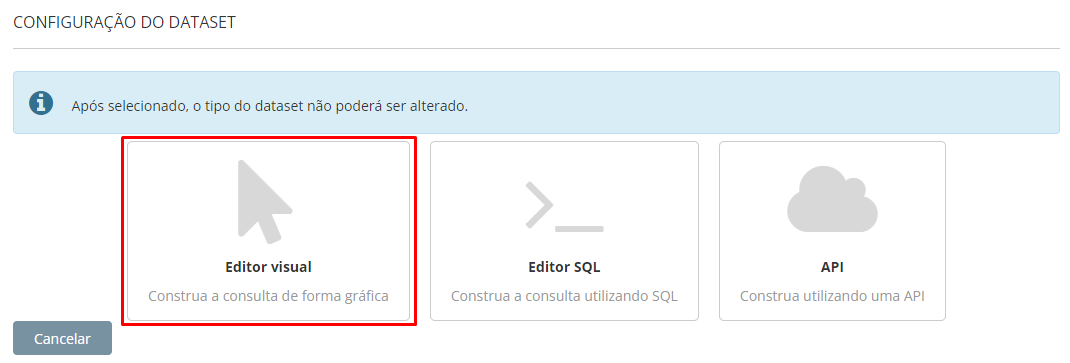
When selecting theVisual editor, the fields that will be used to configure the dataset will be presented.
The purpose of this example is to create a graph that shows thedistribution of people by gender, therefore the dataset will be configured as follows:
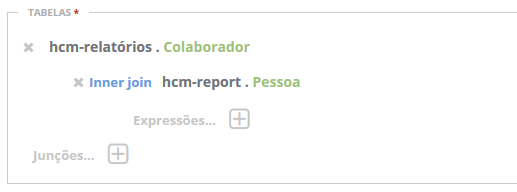
3. Tables:
This section is used tochoose tables which will be used to extract the information that will make up the dataset.
In this example, two tables were selected:
- hcm-reports. collaborator — contains general data on the organization's employees.
- hcm-reports. Person — contains general data from Person records.
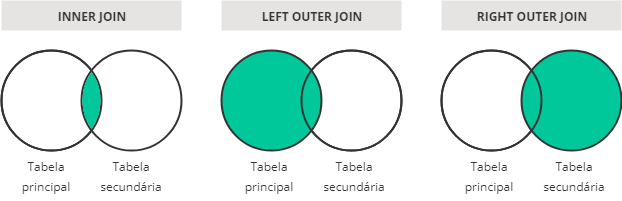
It is also necessary to define thetype of junction between these tables. For this example, the type was selectedInner join:
- Inner join: returns the records that are common to the two tables that were selected.
- Left outer join: returns records that are in the main table (even if they are not in the secondary table) and records from the secondary table that are common to the main table.
- Right outer join: returns records that are in the secondary table (even if they are not in the main table) and records from the main table that are common to the secondary table.
Each table has different types of information. To find out which tables are available and what data they contain, clickConsult tables.
The list of tables and information for each one is also available in the senior X products user manual:
4. Expressions:
Still when configuring the tables, you need to choose aExpression which determines the link criteria between tables:
- 4.1. Choose which information from the table will be used in the expression. For this example, thePerson Identifier.
- 4.2. Choose the type of expression you want to use (equal to; not equal to; greater than; etc.). In this example the expression will be usedEqual to.
- 4.3. Define how you want to search for information in the table (enter manually, select column or obtain by primitive).
For this example, the option ofselect column. Then, an expression was defined to consider records where thePerson Identifier is the same in both tables:
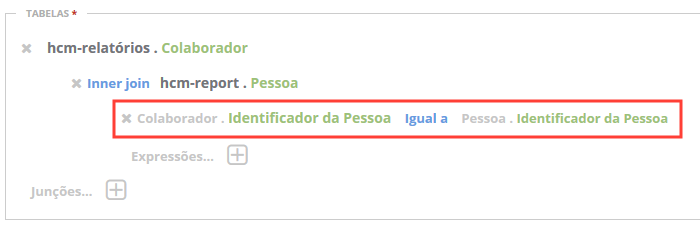
Always define expressions for each type of join, to prevent the query from resulting in a Cartesian product between the tables involved.
5. Projection:
This section is used to select which information will be displayed from the previously chosen tables. To do this, you need to choose theprojection type and theinformation you want to display.
In this example, the following were selected:
- youpure data of gender (Person.Gender)
- Thedistinct quantity Person identifier (Person.Person Identifier)
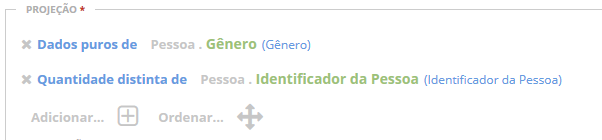
The distinct quantity is used when you want data that has the same identifier or with the same information not to be considered.
- Pure data: returns the final value of the table fields.
- Distinct quantity: returns the number of occurrences, disregarding duplicates (data that have the same identifier or the same value).
- Amount: returns the number of occurrences.
- Maximum It isMinimum: returns the minimum and maximum values of an attribute.
- Sum: returns the sum of attribute values.
- Average: returns the average of the attribute values.
When selecting a field in the Projection, it is possible to change the name that will be displayed later when viewing the dataset. To do this, simply rename the field before saving the choice.
6. Additional Settings:
In addition to the configurations described so far, the dataset also allows you to configure agrouping, oneordering It isfilters.
The documentation below explains how these settings work. However, they will not be used to build the graph in this tutorial.
- Grouping: Groupings are added automatically when a projection of typeamount,maximum, Minimum ,sum or average, together with a projection ofpure data.
- Ordering: allows you to define an ordering for the query data. Several fields can be entered with the orderascending ordownward.
- Filters: allows you to define filters for the query data. Choose one or multiple fields and the type of filter you want to use (equal to;different than;bigger then ; etc.).
It is also possible to define arange filter for the query data, based on the user who is active in the system. To do this, you need to select the optionGet by primitive
while building the expression. There are two options for this type of query:- activeEmployeeFilter — returns the identifier of theactive user.
- descendantsFilter — returns the identifier of the active user in the hierarchy.
Click here to see examples of this configuration.
Another possibility is the inclusion of variable keys, automatically changed at the time of execution. The currently available keys are:
- DATE_NOW = Current date (example: 03/02/2023);
- FIRST_DATE_MONTH = First day of the current month (example: 03/01/2023);
- LAST_DATE_MONTH = Last day of the current month (example: 03/31/2023);
- DAY = Current day (example: 2);
- MONTH = Current month (example: 3);
- YEAR = Current year (example: 2023);
- USER = Logged in user (example: test@senior.com.br).
ObservationFor edits through SQL it is necessary to add: before the variable.
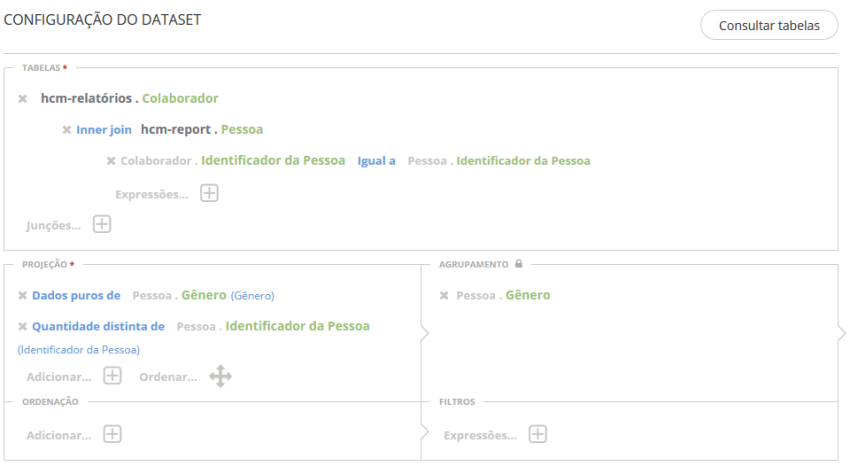
Final dataset result:
After making all the settings above, the complete dataset settings should look similar to the image below:
click inTo save to save the changes. If you want to preview the data that the dataset returns, clickTo view.


