Compensation Cards - Team Analytics
Note
- All Analytics cards will be available as peruser permission settings and the card settings in Panels. The information presented considers the application of the filter, multiple contracts (except in the Compensation Management module) and, if applicable, scope.
- For the Remuneration Management module, it is mandatory to registersalary policy for the company and branch of the manager querying the analytics.
These cards are accessed by the Manager at: Analytics > Team Analytics > Compensation Tab or at Compensation Management > Compensation Analytics - Manager.
Proposals with a pending approval
Displays the number of pending proposals, of which the Manager is responsible for the current approval step.
Salary raises granted in the year
Shows the total value of raises granted to the Workers in the current year. This amount represents the sum of salary raised, calculated by the difference between the previous and the current salaries.
It also shows the total number of Employees who had their salary changed due to classification, merit or promotion.
if the parameterI would like to consider the salary additions in graphics/cards of the Compensation Management module is enabled, the total value of the increases granted will be made up of the sum of the salary increases to the base salary.
Salary summary of the team
Provides a summary of the team salary information, based on the following data:
- Wage bill: sum of the fixed salaries of the team.
- Raises under approval: calculation of the proposed salary minus the value of the current salary. Only the values of final proposals in the approval process are valid. To view the list containing the raises that are awaiting approval, as well as the details of each proposal submitted by the Worker, click on the Raises under approval results.
- Scheduled raises: the total value of the scheduled raises is obtained by adding the value difference of each current salary to the respective scheduled raises.
The displayed data refers to hourly and monthly workers.
Salary framework
Displays the view of the team salary framework, indicating how many led people are below the first range, between the first and the last range, and or above the last range of the job/position, considering the salary table associated with it.
In a structured job and salary plan, the salary framework must ensure the worker's salary is within the start and end ranges of the job/position he or she occupies.
It is possible via the buttonExport files in formatXLSto be used in table editors (example Excel) with data from the cards so that the user can carry out detailed analysis of the data. When clicking on export, the system will show a notification that the information on the employees' salary structure is being processed. This notification will be displayed in the bell on the platform. Within the bell notification the user will be able to download the file. This button will also be available when clicking on a graph, for example the graph that shows who is below, within or above the salary range.
Importante
Para a utilização da função Exportar, é necessário abrir um ticket para o suporte, onde mediante serviço o respectivo tenant será incluso como piloto para testes.
Details of the Salary Framework chart
When clicking on the Salary Classification graph, a list of employees who are below the salary range, compared to the respective salary range assigned to the position, is displayed. With this information, the movements that affect the salary mass of the company can be viewed.
In the Salary difference column, the percentage data, located below the salary value, can be displayed in two ways:
- Considering the percentage exceeded or missing to reach the range. Examples:
- - 40 %
- below: Salary is 40% below the salary range assigned to the position.
- Considering the percentage reached by each worker, where the higher the value, the better will be the worker's position in the salary framework. For example:
- 40%Reached: the salary reached only 40% of the salary range assigned to the position, i.e. it is below of the track.
- 100% achieved : the salary has reached 100% of the salary range assigned to the position, that is, it isinside of the track.
- 190% Reached : the salary reached 190% of the salary range assigned to the position, that is, it is 90% above of the track.
The form of displaying the data in percentages, from the columnDifference, is configured in: Compensation management > Settings > General tab > question 'How do you prefer to view the salary difference of employees compared to the salary range assigned to the position?'.
Note
- It is possible to change the way of displaying the data in percentages, from the columnDifference, any time. However, whenever the exhibition option is modified, it will be applied for the headquarters workers as well as the ones at the company branches.
- It is also possible to hide the display of data in column percentages.Difference, remaining only the wage difference in reais (current currency), of employees who are above or below the salary range, compared to the market range.
- If the parameterI would like to consider the salary additions in graphics/cards of the Compensation Management module is enabled, the amount of the salary of each employee will be the sum of the additional salaries + the amount of fixed salaries.
Filter
It is possible via the buttonSee details, search for collaborators, and thus speed up the process of finding them. The export continues to be done only when there is no filter running.
The filter also has a validation of at least 3 characters for its execution, therefore, if only 2 characters are added in the search field, nothing will happen. It is important to point out that the search is performed a few seconds after the end of typing in it.
Indicated for salary raise
This ranking
To compose the ranking, the HR department must configure the considered indicators and define the weight of each one. The indicators are:
- Evaluation per competences: value of the result obtained in the finished competence evaluation. The Performance Management module is required to use the Competence Evaluation indicator.
- Results evaluation: value obtained in the finished results evaluation. The Performance Management module is required to use the Results Evaluation indicator.
- Distance to the market reference range: a comparison is made between the Worker's current salary value and the market reference value, which is registered in the salary table. This distance is measured in percentage points.
- Last spontaneous salary raise time: number of months since the last salary raise of the Worker.
- Time on the job: number of months during which the Worker is in the same job.
- Salary Range: details the nominees who arebelow the range, above the range orwithin range the employee is currently in.
If HR has configured some parameters, arising from the salary policy, there will be a time limit to be considered for a new salary increase to occur for the same Employee. These criteria increase rotation by preventing the same Worker from staying on top of the list, regardless of his or her final score.
In this way, the following salary policy parameters must be considered:
- What is the minimum last raise time limit allowed?: the number of months between the last increase (spontaneous) of the employee and the current date must be greater than or equal to the number of months registered, so that it can be included in the graph of Indicated for salary increase.
- What is the time limit for below starting salaries?: if the employee is below the initial salary range, the time between the last increase (spontaneous) and the current date must be equal to or greater than the number of months registered in the parameter, so that it appears in the graph.
Also, if the employee already has scheduled spontaneous raises (which can be viewed in the Salary Evolution graph), he will not be considered as a candidate to receive a salary increase.
Note
The filled bar next to the Worker's name can have one of these three colors, depending on the criticality level, and suggests the workers priority for a salary raise:
- Red bar: when the Worker's situation is critical and the results totaled more than 66 points. Points are calculated from the result obtained in the performance aspect, summed to the salary information.
- Yellow bar: alert situation. The Worker obtained 33 to 66 points.
- Green bar: the Worker might have to wait to receive a proposal. This bar is shown when the result is under 33 points.
Export
It is possible via the buttonExport files in formatXLSto be used in table editors (example Excel) with data from the cards so that the user can carry out detailed analysis of the data. When clicking on export, the system will show a notification that the information on the employees' salary structure is being processed. This notification will be displayed in the bell on the platform. Within the bell notification the user will be able to download the file. This button will also be available when clicking on a graph.
Importante
Para a utilização da função Exportar, é necessário abrir um ticket para o suporte, onde mediante serviço o respectivo tenant será incluso como piloto para testes.
Filter
It is possible via the buttonSee details, search for collaborators, and thus speed up the process of finding them. The export continues to be done only when there is no filter running.
The filter also has a validation of at least 3 characters for its execution, therefore, if only 2 characters are added in the search field, nothing will happen. It is important to point out that the search is performed a few seconds after the end of typing in it.
Remuneration x Performance
This scatter chart compares the workers' remuneration according to the performance obtained in the Results and Competence Evaluations.
The remuneration presented may be the fixed salary of each employee or the sum of the additional salaries + the value of the fixed salaries, if the parameterI would like to consider the salary additions in graphics/cards of the Compensation Management module be enabled.
In the X-Axis, the performance level (Below, Within or Above) of the last finished cycle is shown. The Y-Axis displays the salary ranges and considers the market reference range defined in the salary table as 100%. The axis positioning is calculated by the percentage of the worker's current salary over the market reference range, i.e., current salary / market reference salary of the job/position × 100.
Managers may view the information of their directly and indirectly-led people. The led person will show up in the chart if the last cycle of the competence and results evaluations is finished. In the chart, led people may also be filtered by gender.
By clicking in the chart icons, details of the led person are displayed, such is identification data, job and salary, succession and quadrant information explanations. The icon colors are configurable and, as shown in the example below, they follow the criticality scale.
| Salary range | 120% | 120% RANGE - PERFORMANCE BELOW
Salary range much greater than what is indicated for workers whose performance is below the expected for the job. |
120% RANGE - PERFORMANCE WITHIN
Greater salary range for workers who frequently show adequate performance for the job. |
120% RANGE - PERFORMANCE ABOVE
Salary range compatible with workers whose performance and maturity shown ate distinguished in the occupied job. |
| 110% | 110% RANGE - PERFORMANCE BELOW
Salary range greater than what is indicated for workers whose performance is below the expected for the job. |
110% RANGE - PERFORMANCE WITHIN
Salary range slightly greater than what is indicated for workers who frequently show adequate performance for the job. |
110% RANGE - PERFORMANCE ABOVE
Salary range compatible with workers whose performance is greater than the expected for the job. |
|
| 100% | 100% RANGE - PERFORMANCE BELOW
Salary range slightly greater than what is indicated for workers whose performance is below the expected for the job. |
100% RANGE - PERFORMANCE WITHIN
Salary range adequate for workers who frequently show adequate performance for the job. |
100% RANGE - PERFORMANCE ABOVE
Salary range slightly lower than what is indicated for workers whose performance is greater than the expected for the job. |
|
| 90% | 90% RANGE - PERFORMANCE BELOW
Salary range compatible with workers whose performance is below, but they are progressing adequately towards what is expected for the job. |
90% RANGE - PERFORMANCE WITHIN
Salary range adequate for workers who frequently show adequate performance for the job. |
90% RANGE - PERFORMANCE ABOVE
Salary range lower than what is indicated for workers whose performance is constantly greater than what is expected for the job. |
|
| 80% | 80% RANGE - PERFORMANCE BELOW
Salary range adequate for workers who are starting on the job or who have competences to be developed. |
80% RANGE - PERFORMANCE WITHIN
Salary range slightly greater than what is indicated for workers who frequently show adequate performance for the job. |
80% RANGE - PERFORMANCE ABOVE Salary range much lower than what is indicated for workers whose performance is above the expected for the job. |
|
| Below | In | Above | ||
| Performance | ||||
Performance distribution ranges
| Below | 0 to 60 |
| Inside | 60.01 to 100 |
| Above | 100.01 to 250 |
Observation
To parameterize the quadrants, distribution ranges and axes, a call must be opened in the tool0800net for Senior, along with the table design.
Salary average
This chart displays the salary average of led people (all or directly-led), serving as a basis for values offered in salary adjusts or raises (spontaneous and legal) or admission of workers. By analyzing the chart, you can check whether a value is in, above or below the salary average of the team.
if the parameterI would like to consider the salary additions in graphics/cards of the Compensation Management module is enabled, the average salary of employees will consider the base salary + the amount of additional salaries.
Average promotion time
Displays the average time the team and the workers have not got any job promotions, facilitating the career management of the team.
Information is based on the current date and on the date of the last job change. Employees are sorted on the chart according to length of service. If the employee has not yet completed 1 year of work in the company, it will be represented by 0.
Average salary raise time
Displays the average time that the team and employees are without receiving a salary increasespontaneous. Employees are sorted on the chart according to length of service. If the employee has not yet completed 1 year of work in the company, it will be represented by 0.
To display the information, one of the data on which the frame is based is the difference between the current date and the date of the last salary raise. In this verification, legal salary adjusts are not considered.
Important
It is mandatory to register a salary policy for the company and branch of the manager who is consulting the analytics.
Salary evolution
This chart allows you to check the salary evolution of the team, displaying variations that occurred in the worker's salaries. These are some characteristics of the information displayed by the chart:
- By default, the considered period are the last three years, with filters allowing the selection of specific periods.
- The salary value of monthly and hourly employees are presented according to the settings made by HR, in the parameterWhat option is used to display employee salaries on the manager and HR panels?
- If there are two changes to the employee's salary on the same date, the graph will only show the value of the last readjustment entered in the salary history.
- In addition to the salary amount, the chart also shows the percentage of readjustments (spontaneous and legal) that the contributor received. Months that have not had readjustments will not be displayed.
- The Manager can choose to view the salary evolution of the employees, including only his direct subordinates or all those subordinated under his hierarchy, through the filtersdirect subordinates It isall led. It is possible to select specific collaborators, searching by name and it is also possible to filter by manager in all companies.
- if the parameterWould you like to consider additional wages in graphics/cards in the Compensation Management module? is enabled, the employees' salary will be composed of the sum of the base salary + the amount of additional salaries, as follows:
- When only the value of additional wages is changed, there will be no movement of the benefited employee in the graph;
- The salary value of employees who do not receive additional will remain the same in the graph, even if the parameterWould you like to consider salary additions in graphics/cards in the Compensation Management module? be enabled.
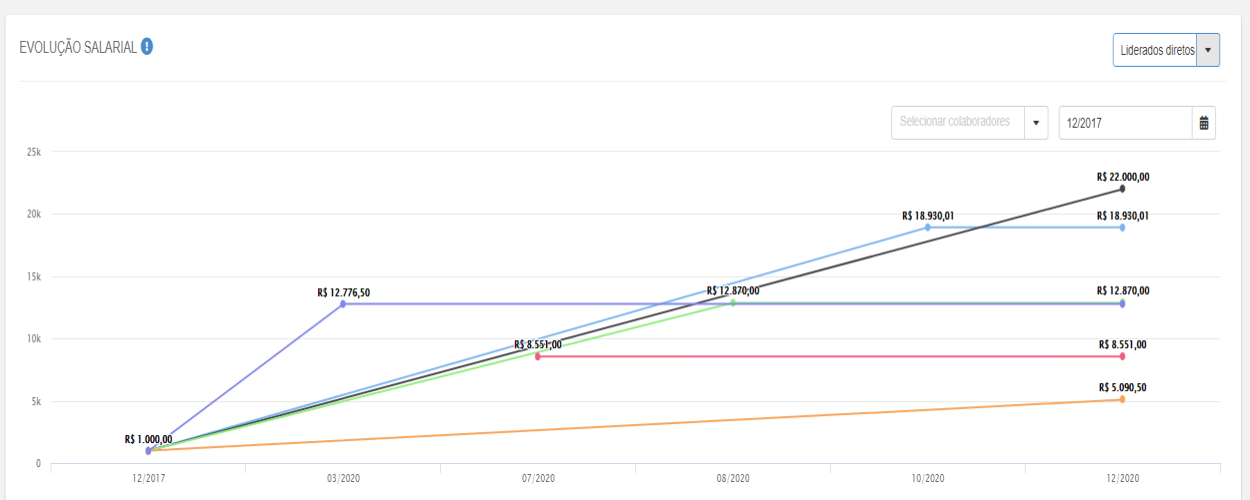
Graph Details Wage EvolutionThe visualization of the employees' salary evolution is displayed in two ways, according to the number of selected employees.
expanded viewImportantThe graph only shows the salary evolution of the employee's active contract.
- This view comprises up to 14 collaborators. About the chart points:Starting point: the starting point includes the salary mass of all employees selected in the filter, that is, the sum of their respective salaries in that period, regardless of whether they received a salary increase. By system default, the starting point considers the three years prior to the current year. For example: in December 2020, the starting point will be December 2017.
- points per month: between the starting point and the ending points, only employees who had a salary increase will be mentioned;Endpoints : Shows the current salary of each of the selected employees, even those who have not received a raise in that month.
- grouped view
- Whe n the number of employees to be shown on the graph is equal to or greater than 15, the system will group the information on employee transactions in a single line, as follows:
- Starting point
- : b
l employees, it presents a single value, which is the wage bill for that month, that is, the sum of the salaries of all employees selected for visualization in the graph (including those who did not receive a salary increase);points per month: each month represents the sum of the salaries of employees who received raises in that month;Full stop : represents the wage bill for the month (including those who did not receive a wage increase).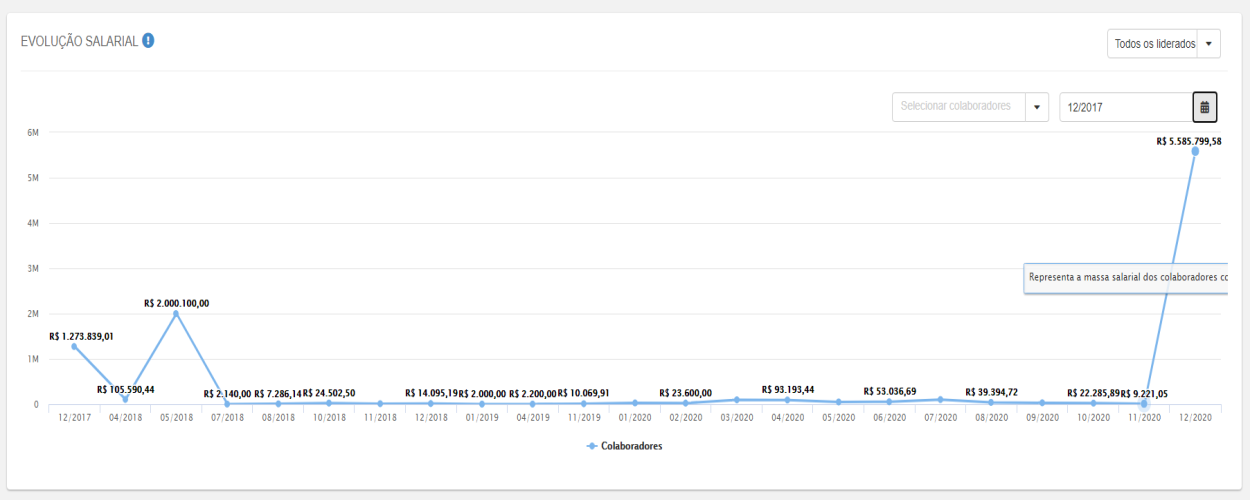
 English
 Español