Cards de Remuneração - Analytics do RH
Note
- All Analytics cards will be available as peruser permission settings and the card settings in Panels. The information presented considers the application of the filter, multiple contracts (except in the Compensation Management module) and, if applicable, scope.
- For the Remuneration Management module, it is mandatory to registersalary policy for the company and branch of the manager querying the analytics.
O painel é acessado em Gestão de Remuneração >
A tela do Analytics apresenta cards e gráficos constando dados gerais da empresa. No entanto, o RH pode conferir também os cards e gráficos acessados pelos gestores sobre suas respectivas equipes, através dos filtros Gestores e Liderados.
Após escolher um(a) Gestor(a) para filtrar, é possível escolher a forma de inclusão dos respectivos colaboradores, de acordo com a hierarquia da empresa. As opções de visualização do filtro Liderados são Todos os liderados ou Liderados diretos.
Important
- As informações apresentadas no Analytics de Remuneração - RH não são atualizadas em tempo real, é preciso atualizá-las manualmente.
- As informações apresentadas no Analytics de Remuneração - RH são previamente processadas.
Proposals
Shows the number of proposals that have their evaluations pending, i.e., that were already approved by the managers. This calculation considers all Workers in the company who have proposals that are approved and simply waiting for the execution (salary change).
The number of proposals that are pending an HR approval can also be viewed, as long as the HR department has permission to execute this approval, in addition to the proposal execution.
The number of proposals in progress is also displayed. This calculation considers all Workers in the company who have proposals in progress (in the process of approval). With these information, the HR department can monitor open proposals and identify managers with pendencies.
Salary proposal lists and details can be accessed in the Manage Proposals screen.
Importante
Quando o usuário clicar no card pra detalhar, o sistema ainda não respeita o filtro aplicado no painel.
Average movement time
Displays the average promotion and salary raise times of the company Workers, which can be used to analyze internal variations and make comparisons with the market.
- Promotion: the average time calculation considers the time of the latest job movement of the Worker with the "Promotion" reason. If the Worker has received no promotions yet, the admission date is considered for the calculation of the
- Salary raise: the average time calculation considers the time of the latest salary movement of the Worker with the "Merit" or "Framework" reasons.
Important
Os dashboards representam os 3 motivos configurados no remuneração. A parametrização dos mesmos é feita nas configurações do remuneração e podem ser associados a qualquer motivo existente na G5. Existe a limitação de configurar apenas três motivos, representados no Cloud pelos nomes de Mérito, Enquadramento e Promoção.
Salary average of the company
Apresenta a média salarial de todos os Colaboradores e a diferenciação entre salário de homens e mulheres. O cálculo é formado pela soma dos salários fixos, dividido pelo número de Colaboradores.
For Workers with the Hourly salary type, the hourly salary value is multiplied by 220 for the monthly reference value.
Details of the Salary Average of the Company chart
Details of the information can also be viewed by clicking on the salary average chart. In this screen, all Workers who make up the salary average are displayed, sorted by name.
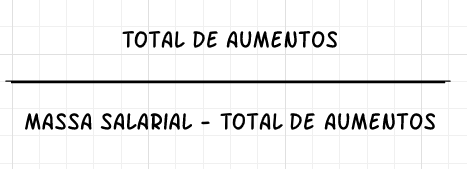
Aumentos concedidos no ano
Apresenta o valor total de aumentos concedidos para os Colaboradores dos gestores no ano corrente. Este montante representa a soma dos aumentos salariais, calculada pela diferença entre o salário anterior e o atual.
Também apresenta a quantidade total de Colaboradores que tiveram o salário alterado devido ao enquadramento, mérito ou promoção.
Se o parâmetro Gostaria de considerar os adicionais salariais em gráficos/cards do módulo Gestão de Remuneração for habilitado, o valor total dos aumentos concedidos será composto pela soma dos adicionais salariais ao salário base.
Apresenta também, o percentual de reajustes concedidos para os Colaboradores no ano em relação a massa salarial.
Este cálculo é definido através da fórmula abaixo:
Salary framework
Displays the percentage of Workers by framework in the salary table (below, in, above). Salary information is searched primarily in the job position and if no information is found, it is obtained from the job itself.
Confira no exemplo como é feito o cálculo para identificar a posição salarial do colaborador.
Salário: R$ 900,00
Valor da faixa de mercado: R$ 1.000,00
Cálculo: Salário / Faixa de mercado
900 / 1000 = 0,9
Posição salarial: 90%
Details of the Salary Framework chart
Upon clicking on the Salary framework chart, a list of workers who are below the salary range, in comparison with the market range, is displayed. With this information, the movements that affect the salary mass of the company can be viewed.
In the Salary difference column, the percentage data, located below the salary value, can be displayed in two ways:
- Considered the exceeded or remaining percentage in relation to the range.
- - 40% below: the salary is 40% below the market range.
- 90% above: the salary is 90% above the market range.
- Considering the percentage reached by each worker, where the higher the value, the better will be the worker's position in the salary framework. For example:
- 40% reached: the salary only reached 40% of the market range, that is, it is below the range.
- 100% reached: the salary reached 100% of the market range, that is, it is within the range.
- 190% reached: the salary reached 190% of the market range, that is, it is 90% above the range.
The data displaying method as percentages, in the Difference column, is configured at Remuneration Management > Configurations > General tab, in the 'How do you prefer to view the salary difference of the workers in comparison with the salary range of the market?' question.
Observações
- É possível alterar a forma de exibição do dado em percentuais, da coluna Diferença, a qualquer momento. However, whenever the exhibition option is modified, it will be applied for the headquarters workers as well as the ones at the company branches.
- Também é possível ocultar a exibição do dado em percentuais da coluna Diferença, permanecendo somente a diferença salarial em reais (moeda corrente), dos colaboradores que estão acima ou abaixo da faixa salarial, em comparação à faixa de mercado.
-
Indicados para aumento salarial
Para a formação do ranking, o RH deve configurar os indicadores considerados e informar o peso de cada um. Os indicadores são:
- Avaliação por competências: o valor do resultado obtido na avaliação por competências concluída. Para utilizar o indicador de Avaliação por competências é necessário possuir o Módulo Gestão de Desempenho.
- Avaliação de resultados: o valor obtido na avaliação de resultados concluída. Para utilizar o indicador de Avaliação de resultados é necessário possuir o Módulo Gestão de Desempenho.
- Distância para a faixa de referência de mercado: é realizada uma comparação entre o valor do salário do Colaborador com o de referência de mercado, o qual está cadastrado na tabela salarial. Esta distância é medida em porcentagem (A pontuação da distância para faixa de mercado, é calculada da seguinte forma: Salário do colaborador * 100 / Valor da faixa de mercado - 100).
- Tempo do último aumento salarial espontâneo: a quantidade de meses desde o último aumento salarial do Colaborador.
- Tempo no cargo: a quantidade de meses em que o Colaborador está no mesmo cargo.
Caso o RH tenha configurado as parametrizações: Consistir limite de tempo? e Consistir limite de tempo abaixo do inicial?, provenientes da política salarial, haverá um limite de tempo a ser considerado para que ocorra um novo aumento salarial para o mesmo Colaborador. Esses critérios aumentam a rotatividade, ao evitar que o mesmo Colaborador se mantenha no topo da lista, independente da sua pontuação final. Independente do parâmetro cadastrado em Consistir limite de tempo? o gestor deverá ver no card, todos os colaboradores que estão na abrangência do filtro.
Note
A barra preenchida, ao lado do nome do Colaborador, pode ser apresentada em três cores, variando o nível de criticidade e sugerindo os prioritários a receberem um aumento salarial.
- Barra na cor vermelha: quando a situação do Colaborador é crítica e o resultado contabilizou acima de 66 pontos. Os pontos são contabilizados a partir do resultado obtido no quesito desempenho, somado às informações salariais.
- Barra na amarela: a situação é de alerta. O Colaborador recebeu entre 33 e 66 pontos.
- Barra na verde: o Colaborador pode aguardar para receber uma proposta. Esta barra é preenchida quando o resultado for abaixo de 33 pontos.
Salary evolution of the company
Displays the sum of all fixed salaries of the month and identifies how much of this total represents salary raises (difference between the previous salary and the adjusted one). The sum considers all salary raise reasons and the last day of the month is considered as the reference date for the information search. The chart is divided in the following information:
- Wage bill: is the sum of all Workers' salaries, disregarding the raise in the month.
- Salary raise: is the difference between the previous salary and the current one for Workers who received a raise in the month.
For Workers with the Hourly salary type, the hourly salary value is multiplied by 220 for the monthly reference value.
Details of the Salary Evolution of the Company chart
Details of the information can also be viewed by clicking on the salary evolution chart. This screen displays only workers who has a salary raise in the selected month, sorted alphabetically.
Média salarial
Este gráfico mostra a média salarial dos liderados dos gestores (todos ou diretos), servindo como base para valores oferecidos em reajustes ou aumentos (espontâneos e legais) salariais ou admissão de colaboradores. Analisando o gráfico é possível saber se determinado valor está dentro, acima ou abaixo da média salarial da equipe.
Se o parâmetro Gostaria de considerar os adicionais salariais em gráficos/cards do módulo Gestão de Remuneração for habilitado, a média salarial dos colaboradores considerará o salário base + o valor dos adicionais salariais.
Salary dispersion x Market range
Displays the salary dispersion compared to the market reference range. Workers with the same percentage interval are grouped in the same bubble and the number of workers influences its size.
Bubbles are grouped by percentage interval every 5 points. Example: 0% to 4.99%, 5% to 9.99% and 10% to 15%. The dispersion of the X axis is the number of workers inside the bubble and the market range reference line is positioned on 100%.
Details of the Salary Dispersion x Market Range chart
Details of the information can also be viewed by clicking on the Salary Dispersion x Market Range chart. Shows details of the dispersion chart information, sorting by % compared to the market reference.
Remuneration x Performance
Compares the workers' remuneration according to the performance obtained in the Results and Competence Evaluations.
The worker's data will show up in the chart if the worker has finished a cycle including the results and competence evaluations. The data displayed will always be the results of the last evaluated cycle.
In the X-Axis, the performance level (Below, Within or Above) of the last finished cycle is shown. The Y-Axis displays the salary ranges and considers the market reference range defined in the salary table as 100%. The axis positioning is calculated by the percentage of the worker's current salary over the market reference range, i.e., current salary / market reference salary of the job/position × 100.
By clicking in the chart icons, details of the led person are displayed, such is identification data, job and salary, succession and quadrant information explanations. The situation of led people may be viewed by gender by clicking in the Women or Men icons, outside the chart. The colors of the icons corresponding to each Worker are configurable and, as shown in the example below, they follow the criticality scale. The axes and quadrants can be configured as well.
| Salary range | 120% | 120% RANGE - PERFORMANCE BELOW Salary range much greater than what is indicated for workers whose performance is below the expected for the job. | 120% RANGE - PERFORMANCE WITHIN Greater salary range for workers who frequently show adequate performance for the job. | 120% RANGE - PERFORMANCE ABOVE Salary range compatible with workers whose performance and maturity shown ate distinguished in the occupied job. |
| 110% | 110% RANGE - PERFORMANCE BELOW Salary range greater than what is indicated for workers whose performance is below the expected for the job. | 110% RANGE - PERFORMANCE WITHIN Salary range slightly greater than what is indicated for workers who frequently show adequate performance for the job. | 110% RANGE - PERFORMANCE ABOVE Salary range compatible with workers whose performance is greater than the expected for the job. | |
| 100% | 100% RANGE - PERFORMANCE BELOW Salary range slightly greater than what is indicated for workers whose performance is below the expected for the job. | 100% RANGE - PERFORMANCE WITHIN Salary range adequate for workers who frequently show adequate performance for the job. | 100% RANGE - PERFORMANCE ABOVE Salary range slightly lower than what is indicated for workers whose performance is greater than the expected for the job. | |
| 90% | 90% RANGE - PERFORMANCE BELOW Salary range compatible with workers whose performance is below, but they are progressing adequately towards what is expected for the job. | 90% RANGE - PERFORMANCE WITHIN Salary range adequate for workers who frequently show adequate performance for the job. | 90% RANGE - PERFORMANCE ABOVE Salary range lower than what is indicated for workers whose performance is constantly greater than what is expected for the job. | |
| 80% | 80% RANGE - PERFORMANCE BELOW Salary range adequate for workers who are starting on the job or who have competences to be developed. | 80% RANGE - PERFORMANCE WITHIN Salary range lower than what is indicated for workers who frequently show adequate performance for the job. | 80% RANGE - PERFORMANCE ABOVE Salary range much lower than what is indicated for workers whose performance is above the expected for the job. | |
| Below | In | Above | ||
| Performance | ||||
Performance distribution ranges
| Below | 0 to 60 |
| In | 60.01 to 100 |
| Above | 100.01 to 250 |
Note
To parameterize quadrants, distribution ranges and axes, open a call to Senior in the 0800net tool, with the table design.
Promotion and raise index - Headcount
Displays the promotions/salary raises index history, considering all Workers in the company, as detailed below:
- Promotions: Workers who received a new job in the month and have the reason set to Promotion. The index is calculated by the number of Workers who received a promotion with the total number of Workers in the company.
- Salary raises: Workers who received new salary in the month and have the reason set to Merit and/or Framework. The index is calculated by the number of Workers who received a raise with the total number of Workers in the company.
 English
 Español